Tollgate in your Grafana in 10 minutes
/metrics is always on — no config needed, same port as the proxy, unauthenticated like /healthz. This walks through wiring it into a Prometheus Operator setup (e.g. kube-prometheus-stack) and importing the shipped dashboard.
Want this running in one command with no cluster and no API key? See the docker-compose quickstart instead — it's the fastest way to see every panel populated.
Prereqs
- Tollgate installed via the kind quickstart (or any cluster with the Helm chart installed).
- A Prometheus Operator. If you don't have one yet, the fast path:
helm repo add prometheus-community https://prometheus-community.github.io/helm-charts
helm repo update
helm install prom prometheus-community/kube-prometheus-stack -n monitoring --create-namespace
1. Turn on the ServiceMonitor
The #1 "no data" gotcha: kube-prometheus-stack's Prometheus only scrapes ServiceMonitors matching its serviceMonitorSelector — by default, ones labeled release: <the helm release name you installed prometheus as>. Set prometheusRelease when you enable the toggle — the chart maps it straight to that label, and helm install prints a warning if you forget it:
helm upgrade tollgate deploy/helm/tollgate -f my-values.yaml \
  --set serviceMonitor.enabled=true \
  --set serviceMonitor.prometheusRelease=prom
(prom matches the helm install prom ... above — use whatever release name you actually used.)
2. Verify the scrape
Port-forward Prometheus and check the Targets page:
Open http://localhost:9090/targets — you should see a tollgate target in state UP. If it's missing entirely, the ServiceMonitor's label didn't match Prometheus's selector (see step 1); if it's DOWN, check kubectl logs deploy/tollgate and confirm /metrics responds via kubectl port-forward svc/tollgate 8080:8080 + curl localhost:8080/metrics.
3. Import the dashboard
In Grafana: Dashboards → New → Import, upload deploy/grafana/tollgate-dashboard.json, and pick your Prometheus datasource when prompted (the dashboard ships with a templated datasource input, so it isn't hardcoded to whichever Grafana it was exported from).
4. What "done" looks like
Send a request or two through Tollgate, then watch the Spend by agent panel — it should populate within one scrape interval (30s by default). The other panels (requests/sec, tokens in/out, budget consumed %, budget state, p95 latency, denied requests) follow the same pattern: sum by (agent) (...) queries over the metrics Tollgate exposes.
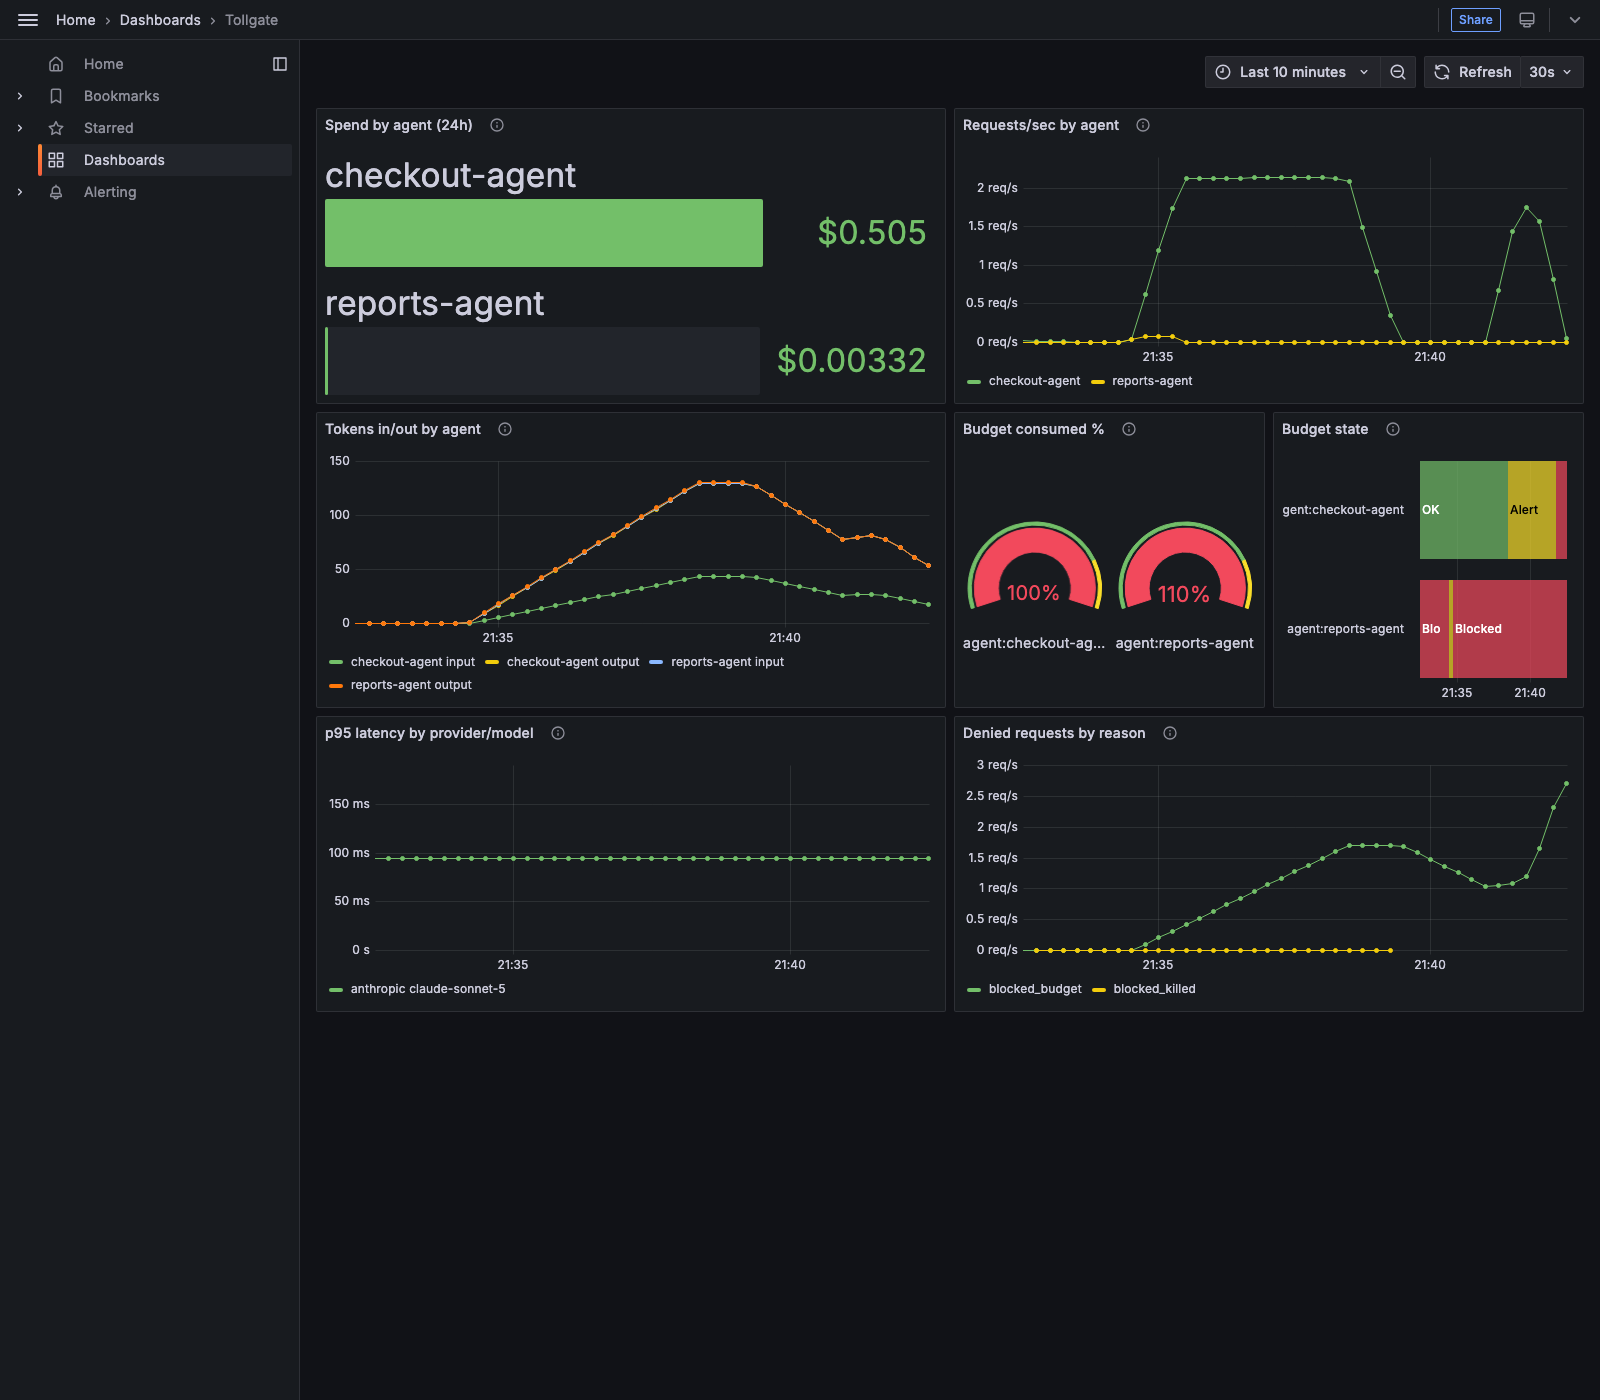
With the chart's production defaults (agents: [], budgets: []) most panels have nothing to group by, so a first install can look broken even though scraping is working fine. values-demo.yaml configures two demo agents/budgets specifically so every panel — including budget state and denied requests, which need an agent to actually hit a budget — has something to show:
helm install tollgate deploy/helm/tollgate -f deploy/helm/tollgate/values-demo.yaml \
  --set config.providers[0].api_key=$ANTHROPIC_API_KEY
Optional: OTLP trace export
If you run a trace collector (Tempo, Jaeger, an OTel Collector, etc.), point Tollgate at it:
One span per proxied request, with gen_ai.* and tollgate.* attributes (agent, team, namespace, cost, token counts). Export is fire-and-forget — a slow or unreachable collector never blocks proxied requests.
Troubleshooting
- ServiceMonitor exists but no data in Grafana: almost always the
release:label mismatch from step 1 —kubectl get servicemonitor tollgate -o yamland compare its labels against your Prometheus'sserviceMonitorSelector. - Some agents missing from panels: expected, not a bug — unattributed/open-passthrough traffic (no
agents:configured, no Kubernetes identity) has noagentlabel to group by. tollgate_cost_usd_totalis0for a known-working agent: check for amodel missing from pricing table, cost recorded as 0warning in the Tollgate logs — cost is0for unpriced models by design, not a metrics bug.